Overview
Completed Current
Business Analysis
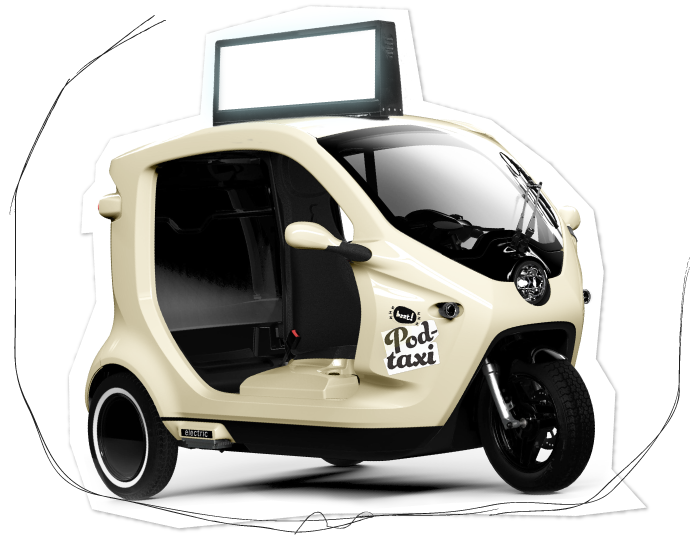
Improving Bzzt Podtaxi Operations
December 2019
This report contains an analysis of data on Bzzt Podtaxi, an ecofriendly transportation system in Stockholm, Sweden. An unsupervised machine learning technique, K-Means, is applied to identify boroughs throughout Stockholm based on a heat map of spatial coordinates
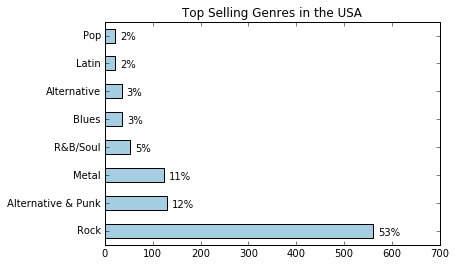
Answering Business Questions using SQL
Summer 2020
Wrote complex SQL queries to confidently answer common business questions. Created python visualizations via Jupyter Notebook to illustrate data trends. Questions Addressed: Which albums should be sold in stores? Which Sales Agents are performing better than others? Which countries have the most potential for business growth?

Titanic Survival Predictions
Spring 2020
This project aims to predict who was most likely to survive the Titanic. A data frame with 2 columns: PassengerID, and the predicted Survival. The predictions were done using Logistic Regression. Logistic Regression Conclusions: The most important factors in determining who survived were: Sex (Females were most likely) Parchild, or SibSp: Whether or not the individual was traveling with others, Class: First class passengers were most likely to survive. Here are some scenarios and the likeliness of survival: Women of any age & in first class were very likely to survive. Women under 40 years old had 100% survival rate. Older men were very likely not to survive. Men traveling in first class with a parent or child had a 50% chance of survival

What Category of Apps are Most Popular: Apple and Google Play market
Summer 2019
In this projcect I analyze data on free, english apps for both the Apple and Google Play market. This data allows projections to be made on which app profiles could be profitable for both markets.
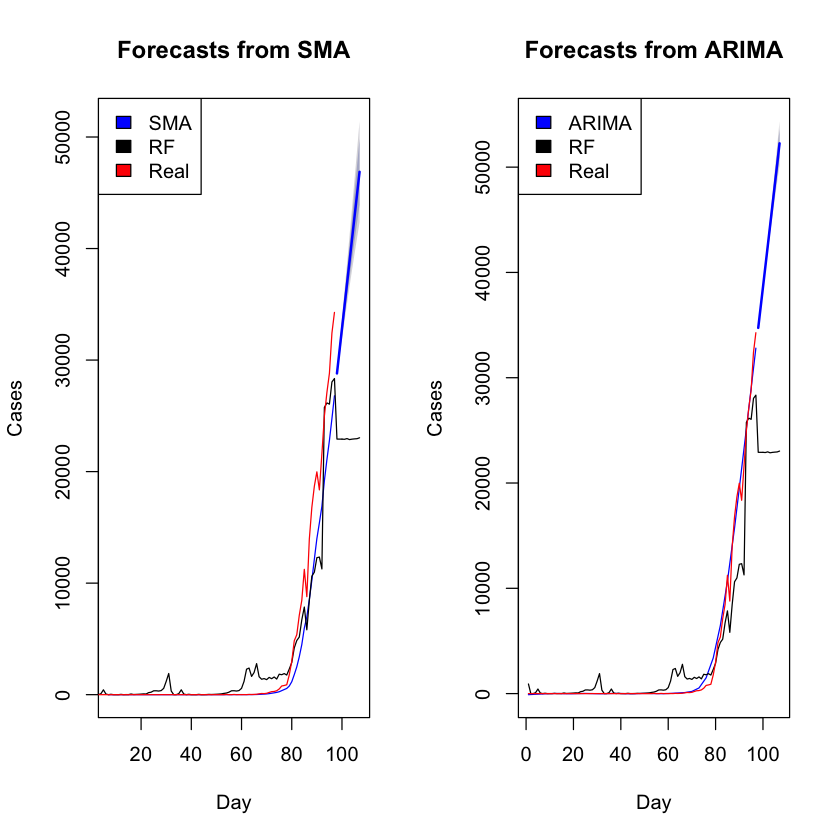
Covid19 Predictions and Time Series Forecasting
Summer 2019
This project aims to make predictions for the number of hospitalizations and cases for Covid-19. The main takeaway from this project is the power of Random Forest. Within the project I compare the power of Decision Trees and Random Forest. I show the importance of ROC analysis as well as exemplify some weakness correlated with forecasting through Random Forest.

Exploring Hacker News Posts
Summer 2019
Hacker News is a site where users can submitt posts which are voted on and commented upon by other users. This site is extreemly popular for technology and startup circles. The top Hacker News posts which have the most comments can get hundreds of thousands of visitors to their websites. In this project I analayze a data set from kaggle to determine whether Ask HN or Show HN posts recieve more comments on average. I then determine at what time of day users get the largest, average number of comments.